I released a new version of my web application RIPE Atlas Tracepath: v0.3.0. It reads results from RIPE Atlas traceroute measurements and shows Autonomous Systems that probes go through to reach the target.
UPDATE: new versions have been released since this post, with new features and bug fixes: please take a look at the project’s page on GitHub.
In the beginning it was a simple Python script/CGI; the new release has been totally rewritten, it’s now based on the D3.js visualization library and uses a more elegant Python backend based on Flask/WSGI.
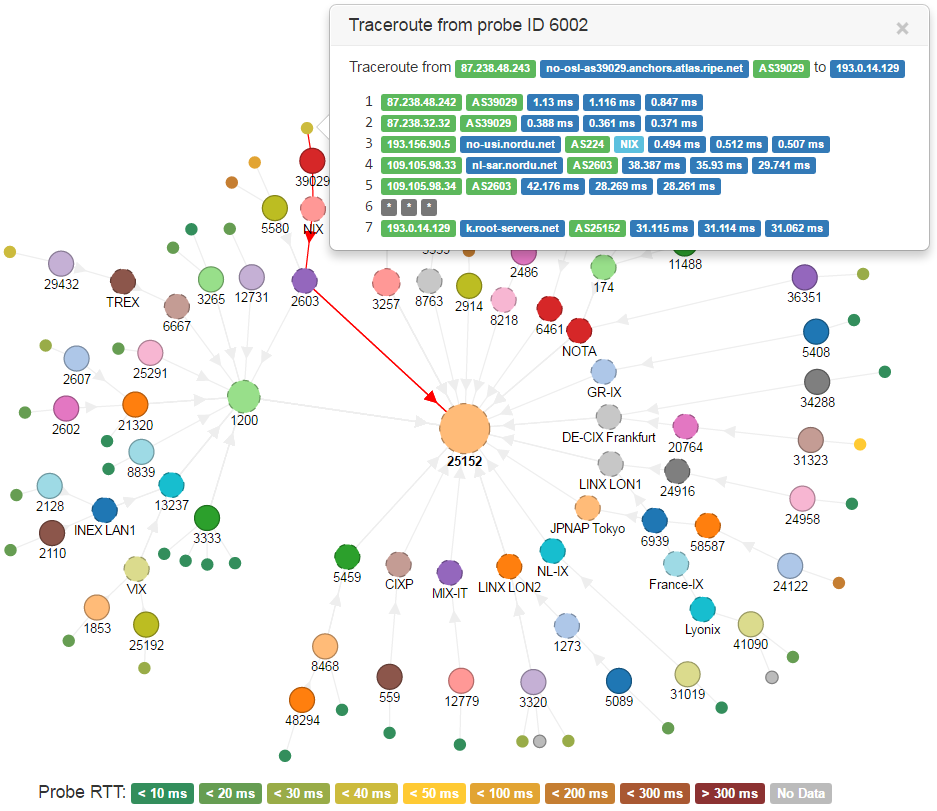
Among the new features, probes are also displayed and linked to their origin AS; for those that completed the traceroute toward the target the avg RTT is also rendered in form of a scale of colors. Multiple Autonomous Systems can now be selected and moved together on the graph, in order to obtain the layout that best describes the analyzed scenario.
A demo can be found here. It only shows results from measurement ID 1674977, a traceroute from 50 probes all over the world toward www.ripe.net:
More details can be found on the GitHub page; feel free to use/edit/fork/improve it as you whish!
Latest posts by Pier Carlo Chiodi (see all)
- Good MANRS for IXPs route servers made easier - 11 December 2020
- Route server feature-rich and automatic configuration - 13 February 2017
- Large BGP Communities playground - 15 September 2016
Leave a Reply